Energy Outlook
July 2024

We’re now in the second half of the year and have just seen a change in government in the recent general election. As the economy exhibits a tentative recovery and the conflicts rage on in Ukraine and the Middle East. Energy prices in the second quarter of the year were far more volatile than most commentators expected, indicating that in spite of us being well beyond the extreme turmoil of 2022, the markets can still get spooked.
This reports looks at the recent movements in energy prices and considers the factors which may have an impact as we move through the summer, including the potential for post-election reforms to the market, the threat of extending European sanctions on imports of Russian LNG and the potential for a new crisis if the Middle East situation escalates.
Energy Price History
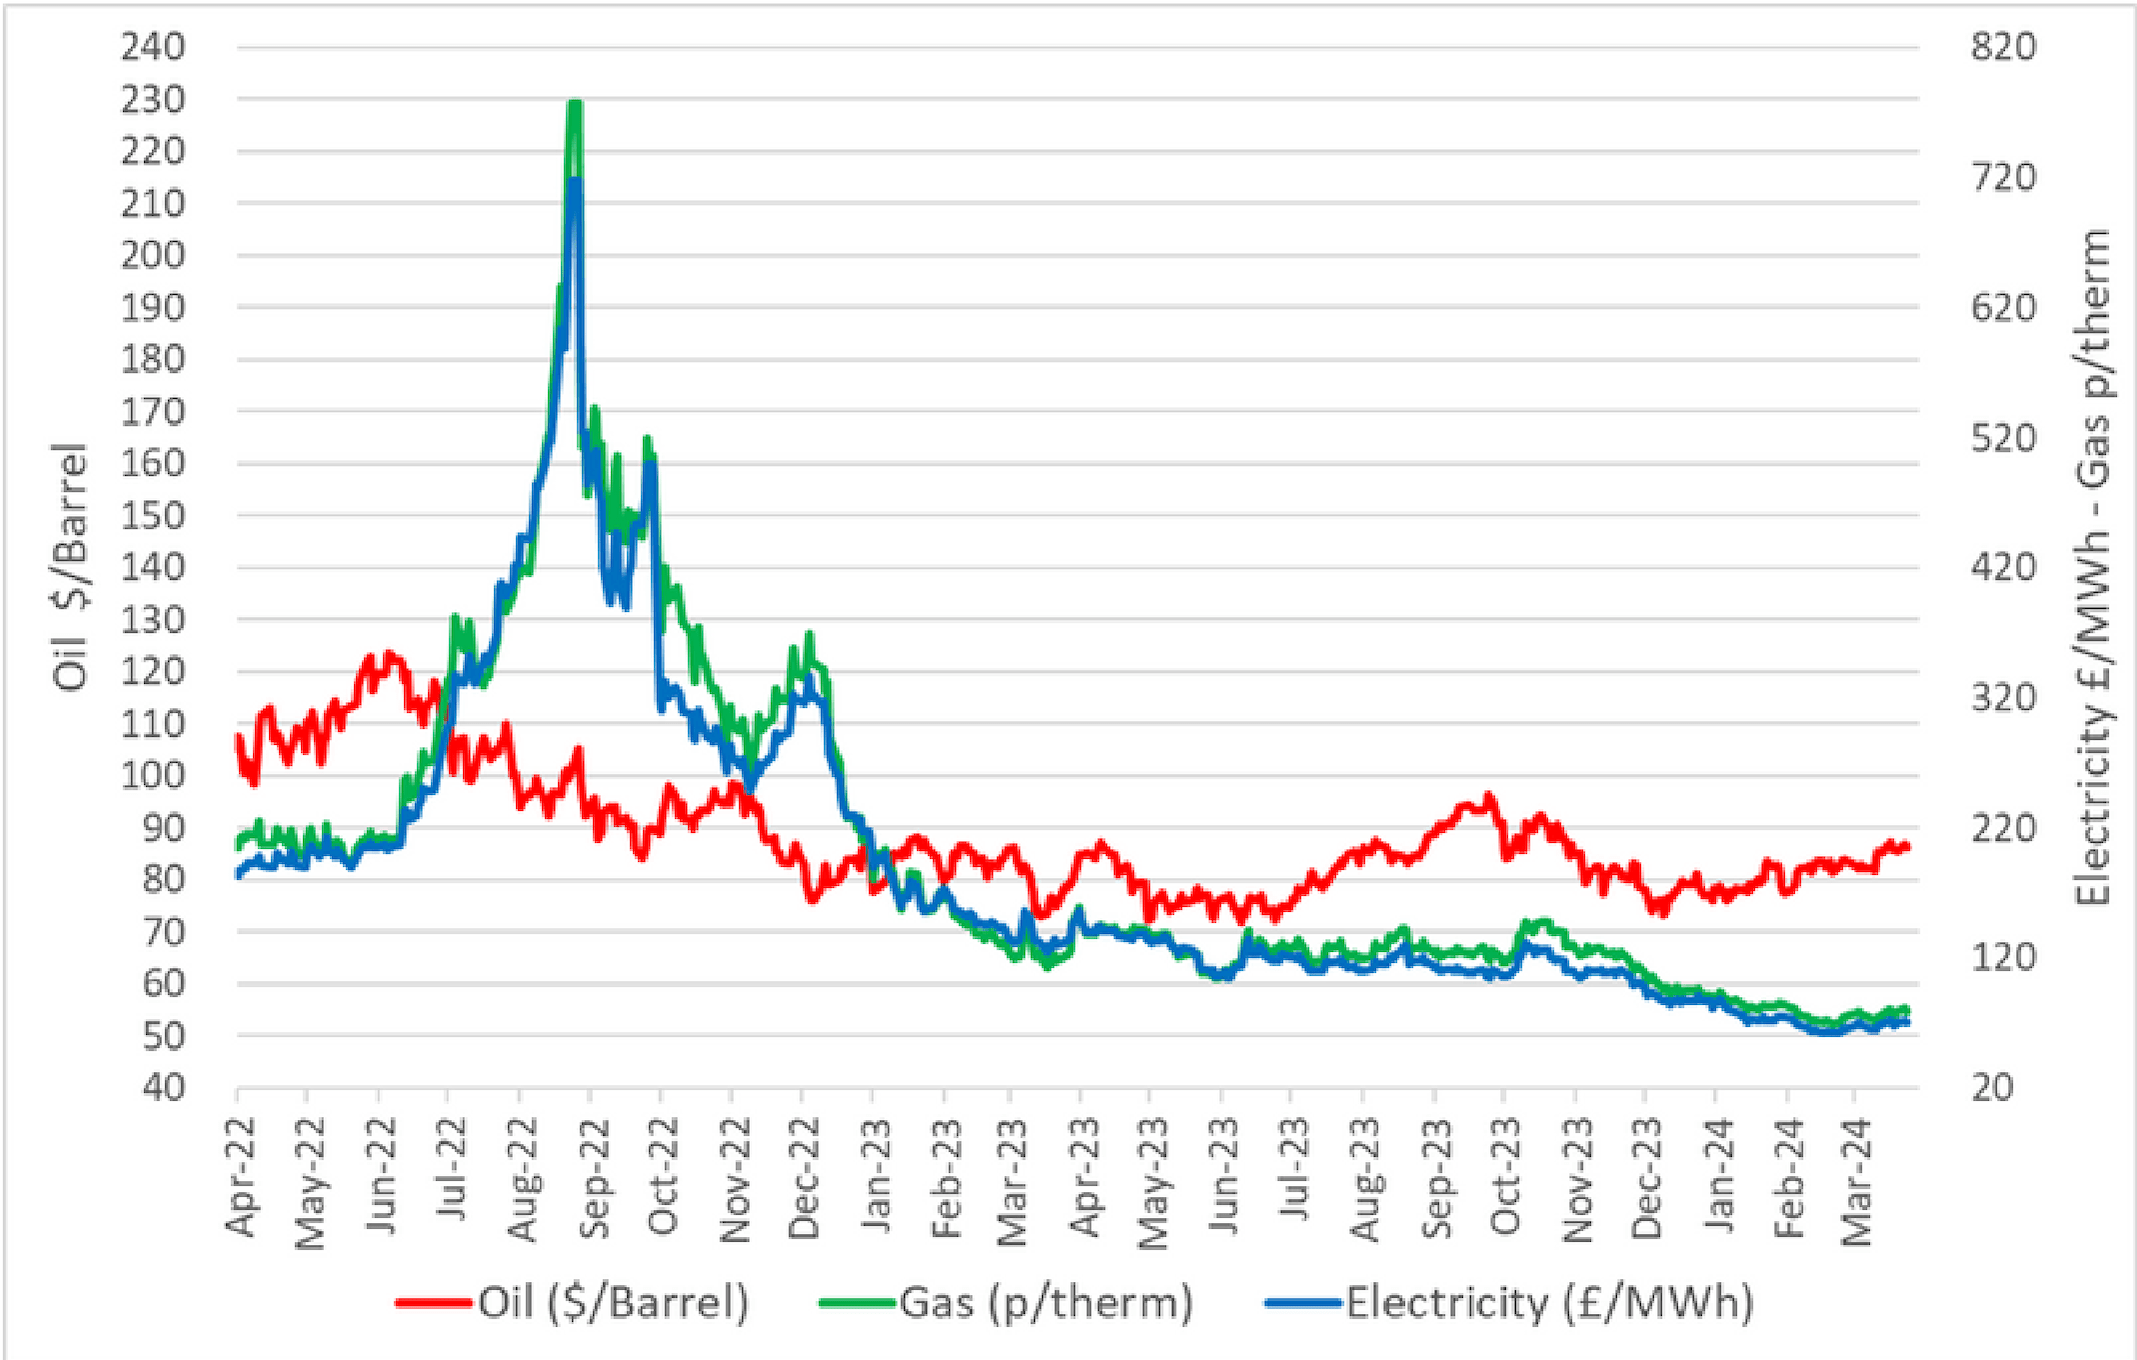
The chart below shows how energy prices have evolved over the past two years. The extreme highs of 2022 give the illusion that markets have now settled, but it would be wrong to get too comfortable. After steady and consistent drops over the last year or so, we have seen volatility return to gas and power after a calm winter and they are now trading at similar levels to a year ago. Oil has taken its own path through the year so far, falling back steadily right up until last month, with a sudden rally putting it firmly back on an upward trajectory once again.
OIL
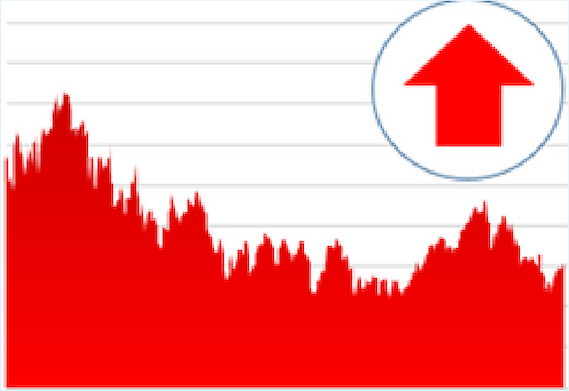 Unusually, movements in oil prices ran counter to gas and power for much of the quarter before a sudden correction in June. This reflects a combination of pessimistic sentiment about global demand, a strengthening dollar (which makes oil more expensive) and high US inventory levels. Furthermore, oil cartel OPEC announced its intention to boost production later on in the year, citing expected growth in spite of an earlier IEA report forecasting weaker demand.
Having dropped back to $77/barrel, prices bounced by nearly $10 within days after Russia refocussed attacks on Ukrainian energy infrastructure which coincided with renewed concern that Iranian action could lock down the strategically important Strait of Hormuz. In reality, the risk of action by Iran in the short term seems low, but the scale of the price movements show how jittery things can be.
GAS
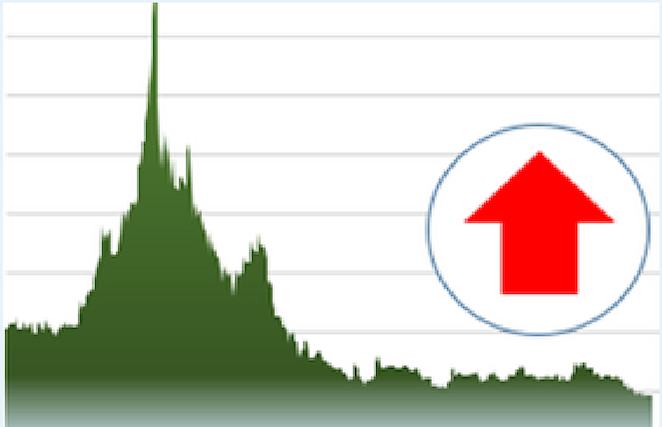
After a cold snap in early January, the weather for the remainder of winter reverted to the same mildness we saw last year, resulting in record storage levels at the end of March and a false sense of certainty that prices would remain stable or drop during the spring. This was disrupted in April and March by a series of planned and unplanned outages of Norwegian North Sea pipelines, combined with an earlier than expected drop off in LNG (liquefied natural gas) supplies as Asian demand picked up in anticipation of hot summer demand. There has also been discussion of potentially extending Russian sanctions to include LNG supplies (which are currently still allowed). This would be a self-defeating move for Europe in the short term, so unlikely to progress until 2025 at least.
Potential disruption or a close-down of the Strait of Hormuz; however, is entirely out of Western hands. It is important to note that 25% of global LNG supplies transits through the strait, so although unlikely, it would cause a renewed global crisis if it were to happen.
ELECTRICITY
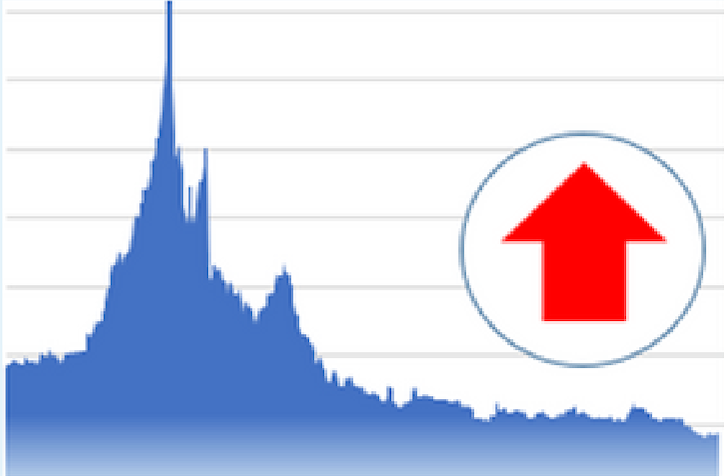
Electricity prices remained primarily driven by gas generation, albeit with its own additional pressures. Renewable generation dropped below expectations in April due to low winds and the French nuclear authority released a warning that the nuclear fleet is ‘not out of the woods’ with respect to corrosion checks, so in spite of the fleet performing better now than at any point in the past three years, traders have not let go of their concern.
Although the general election and change in government is a significant event for the UK, the market has discounted any radical changes which might impact market reform or upstream supply. The details of formation of a new state ‘Great British Energy’ company are scant, but not expected to have a material impact on wholesale prices.
The Market’s Impact on Non-Commodity Costs
The market has impacted several non-commodity cost elements, the most significant being as follows:
Contracts for Difference (CFDs): Cfd costs for those on passthrough contracts were much lower than anticipated over the last year. This is because the CFD mechanism works by paying generators the difference between the market price and an agreed 'strike price'. When the market is very high, generators have to pay the difference back. As the market drops back, CFD costs will increase again, but should not return to pre-crisis levels.
Distribution (DUoS): Distribution costs are recovered from actual consumption. This was much lower last year than anticipated, there has been a significant under-recovery which distributors are allowed to recoup through next year's bills. Customers should expect a one-off jump in charges for this next year.
System Balancing (BSUoS): Historically, BSUOS charges were minimal and predictable, but with a combination of the growth in intermittent generation and extremely volatile wholesale energy prices, the costs have increased five-fold since 2015. The uncertain nature of the costs means that the potential range of prices in the years ahead is very high, although we are not expecting a reduction!
Non-Commodity Costs
Non-commodity costs (or 'non-energy' costs) are charges added to your bill to cover the costs of the National Grid transmission network, local distribution costs, renewable and environmental surcharges, and taxes to ensure the security of supply by subsidising the availability of capacity. These elements make up over half of a typical bill today.
The chart below shows the history and how these are forecast to change for an average customer: 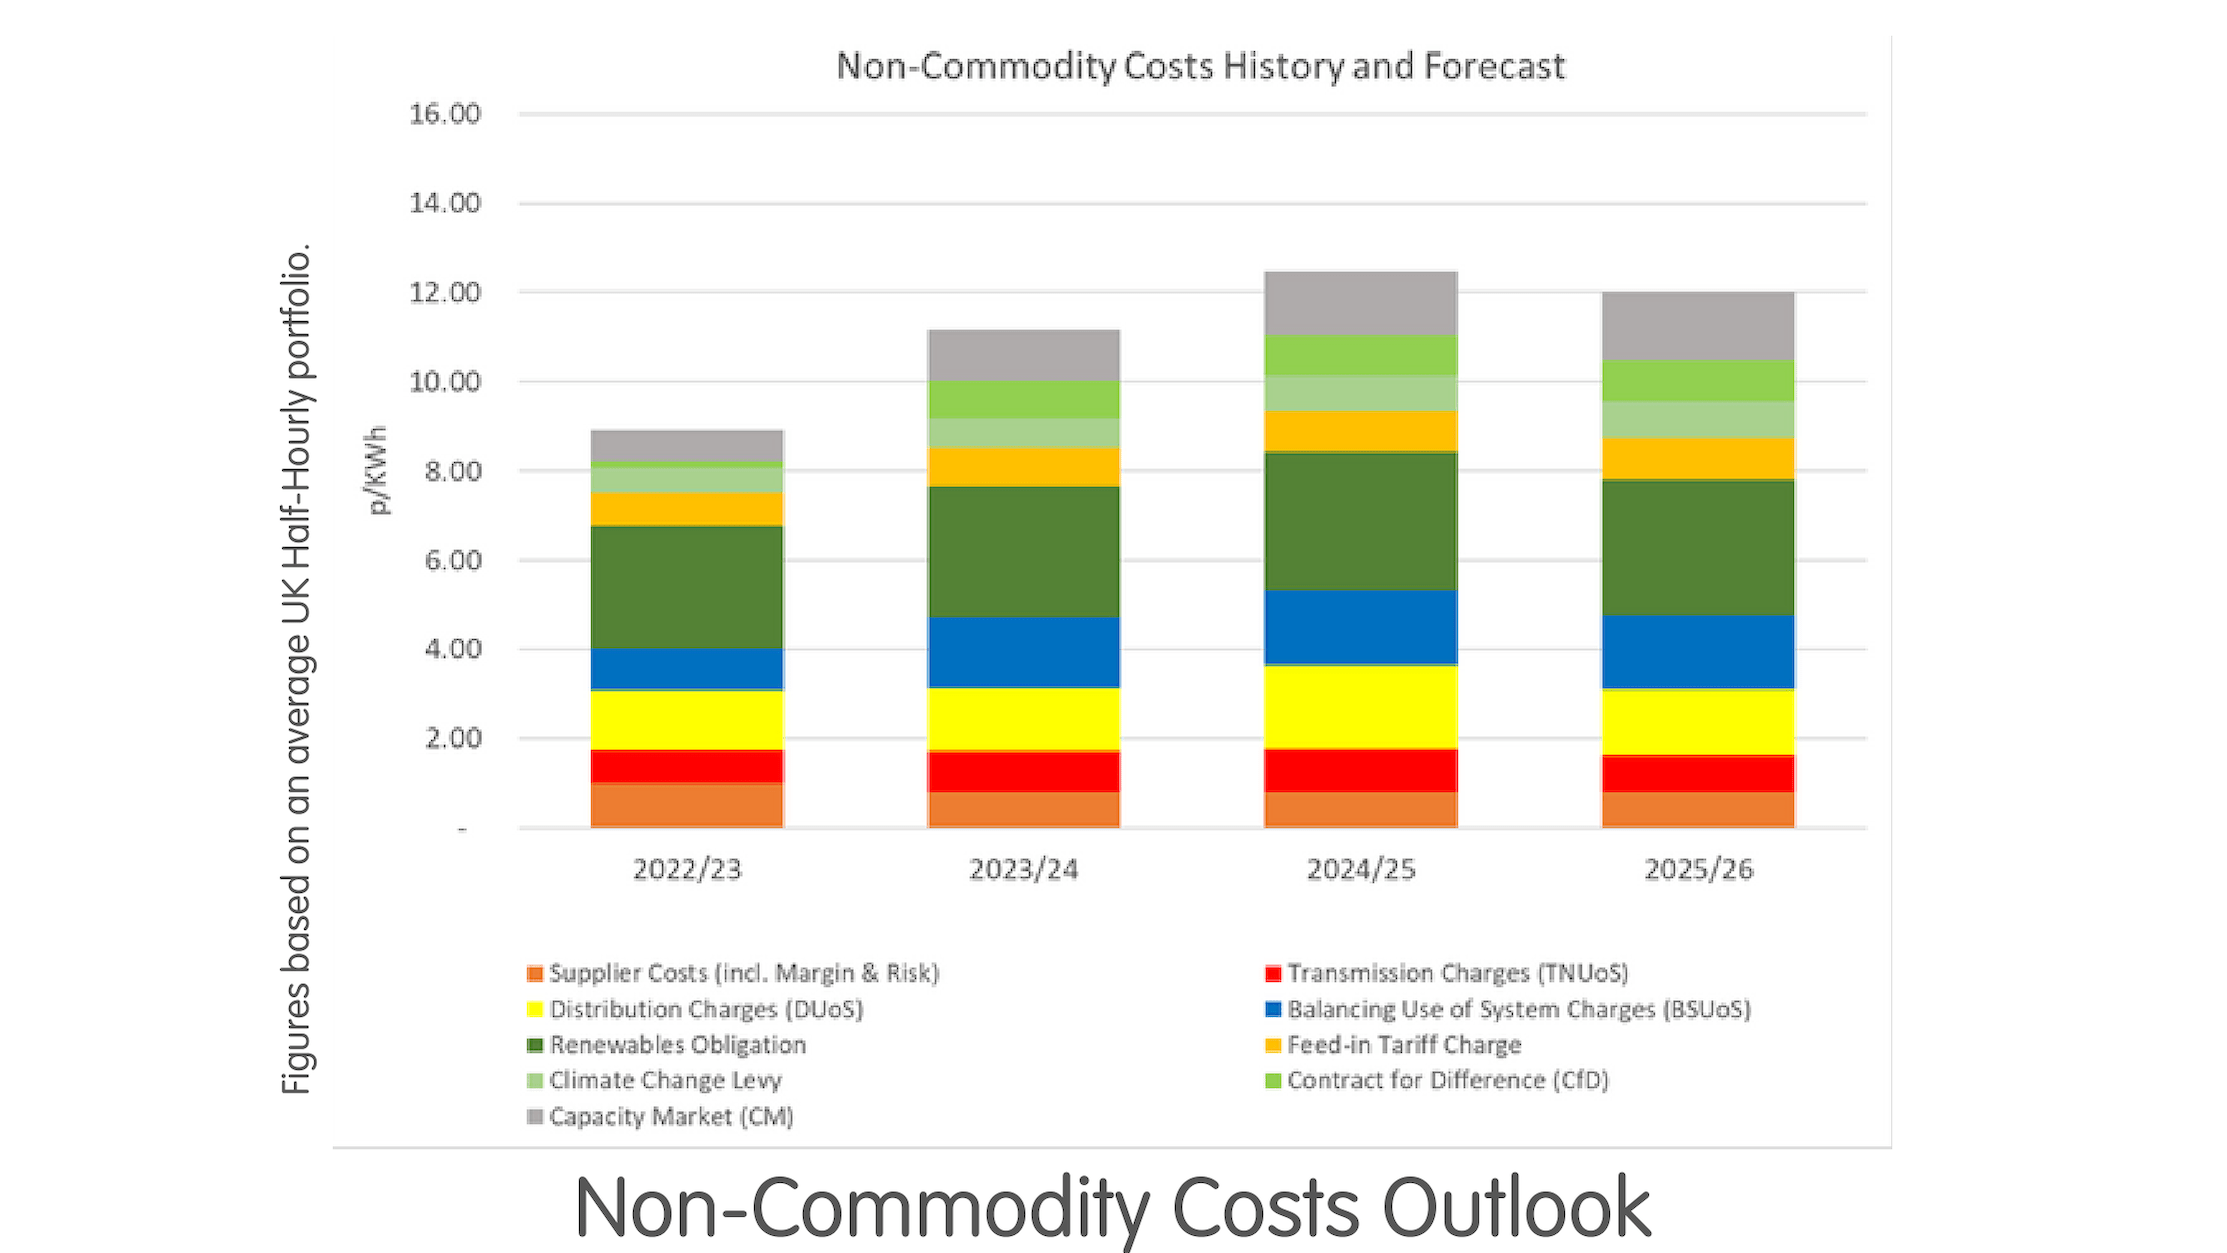
Figures based on an average UK Half-Hourly portfolio.
For more information, please get in touch with your Utility Aid Account Manager or call us on 0808 1788 170
DISCLAIMER – This Outlook Paper is provided for information purposes only and may include opinions expressed by Utility Aid Ltd (“UA”) which are not guaranteed in any way. UA does not represent or warrant that the information provided to you is comprehensive, up to date, complete or verified, and shall have no liability whatsoever for the accuracy of the information or any reliance placed on the information or use made of it by any person or entity for any purpose. Nothing in this Outlook Paper constitutes or shall be deemed to constitute advice or a recommendation to engage in specific activity or enter into any transaction.
 Unusually, movements in oil prices ran counter to gas and power for much of the quarter before a sudden correction in June. This reflects a combination of pessimistic sentiment about global demand, a strengthening dollar (which makes oil more expensive) and high US inventory levels. Furthermore, oil cartel OPEC announced its intention to boost production later on in the year, citing expected growth in spite of an earlier IEA report forecasting weaker demand.


